Interpretable Deep Learning for Time Series Forecasting
December 13, 2021
Posted by Sercan O. Arik, Research Scientist and Tomas Pfister, Engineering Manager, Google Cloud
Multi-horizon forecasting, i.e. predicting variables-of-interest at multiple future time steps, is a crucial challenge in time series machine learning. Most real-world datasets have a time component, and forecasting the future can unlock great value. For example, retailers can use future sales to optimize their supply chain and promotions, investment managers are interested in forecasting the future prices of financial assets to maximize their performance, and healthcare institutions can use the number of future patient admissions to have sufficient personnel and equipment.
Deep neural networks (DNNs) have increasingly been used in multi-horizon forecasting, demonstrating strong performance improvements over traditional time series models. While many models (e.g., DeepAR, MQRNN) have focused on variants of recurrent neural networks (RNNs), recent improvements, including Transformer-based models, have used attention-based layers to enhance the selection of relevant time steps in the past beyond the inductive bias of RNNs – sequential ordered processing of information including. However, these often do not consider the different inputs commonly present in multi-horizon forecasting and either assume that all exogenous inputs are known into the future or neglect important static covariates.
 |
| Multi-horizon forecasting with static covariates and various time-dependent inputs. |
Additionally, conventional time series models are controlled by complex nonlinear interactions between many parameters, making it difficult to explain how such models arrive at their predictions. Unfortunately, common methods to explain the behavior of DNNs have limitations. For example, post-hoc methods (e.g., LIME and SHAP) do not consider the order of input features. Some attention-based models are proposed with inherent interpretability for sequential data, primarily language or speech, but multi-horizon forecasting has many different types of inputs, not just language or speech. Attention-based models can provide insights into relevant time steps, but they cannot distinguish the importance of different features at a given time step. New methods are needed to tackle the heterogeneity of data in multi-horizon forecasting for high performance and to render these forecasts interpretable.
To that end, we announce “Temporal Fusion Transformers for Interpretable Multi-horizon Time Series Forecasting”, published in the International Journal of Forecasting, where we propose the Temporal Fusion Transformer (TFT), an attention-based DNN model for multi-horizon forecasting. TFT is designed to explicitly align the model with the general multi-horizon forecasting task for both superior accuracy and interpretability, which we demonstrate across various use cases.
Temporal Fusion Transformer
We design TFT to efficiently build feature representations for each input type (i.e., static, known, or observed inputs) for high forecasting performance. The major constituents of TFT (shown below) are:
- Gating mechanismsto skip over any unused components of the model (learned from the data), providing adaptive depth and network complexity to accommodate a wide range of datasets.
- Variable selection networksto select relevant input variables at each time step. While conventional DNNs may overfit to irrelevant features, attention-based variable selection can improve generalization by encouraging the model to anchor most of its learning capacity on the most salient features.
- Static covariate encodersintegrate static features to control how temporal dynamics are modeled. Static features can have an important impact on forecasts, e.g., a store location could have different temporal dynamics for sales (e.g., a rural store may see higher weekend traffic, but a downtown store may see daily peaks after working hours).
- Temporal processingto learn both long- and short-term temporal relationships from both observed and known time-varying inputs. A sequence-to-sequence layer is employed for local processing as the inductive bias it has for ordered information processing is beneficial, whereas long-term dependencies are captured using a novel interpretable multi-head attention block. This can cut the effective path length of information, i.e., any past time step with relevant information (e.g. sales from last year) can be focused on directly.
- Prediction intervals show quantile forecasts to determine the range of target values at each prediction horizon, which help users understand the distribution of the output, not just the point forecasts.
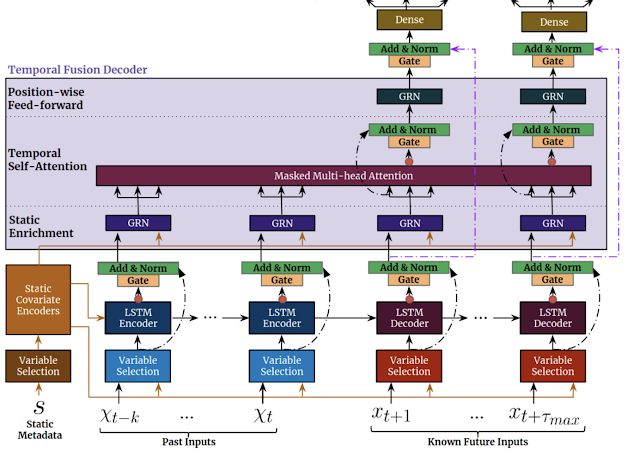 |
| TFT inputs static metadata, time-varying past inputs and time-varying a priori known future inputs. Variable Selection is used for judicious selection of the most salient features based on the input. Gated information is added as a residual input, followed by normalization. Gated residual network (GRN) blocks enable efficient information flow with skip connections and gating layers. Time-dependent processing is based on LSTMs for local processing, and multi-head attention for integrating information from any time step. |
Forecasting Performance
We compare TFT to a wide range of models for multi-horizon forecasting, including various deep learning models with iterative methods (e.g., DeepAR, DeepSSM, ConvTrans) and direct methods (e.g., LSTM Seq2Seq, MQRNN), as well as traditional models such as ARIMA, ETS, and TRMF. Below is a comparison to a truncated list of models.
| Model | Electricity | Traffic | Volatility | Retail |
| ARIMA | 0.154 (+180%) | 0.223 (+135%) | - | - |
| ETS | 0.102 (+85%) | 0.236 (+148%) | - | - |
| DeepAR | 0.075 (+36%) | 0.161 (+69%) | 0.050 (+28%) | 0.574 (+62%) |
| Seq2Seq | 0.067 (+22%) | 0.105 (+11%) | 0.042 (+7%) | 0.411 (+16%) |
| MQRNN | 0.077 (+40%) | 0.117 (+23%) | 0.042 (+7%) | 0.379 (+7%) |
| TFT | 0.055 | 0.095 | 0.039 | 0.354 |
| P50 quantile losses (lower is better) for TFT vs. alternative models. |
As shown above, TFT outperforms all benchmarks over a variety of datasets. This applies to both point forecasts and uncertainty estimates, with TFT yielding an average 7% lower P50 and 9% lower P90 losses, respectively, compared to the next best model.
Interpretability Use Cases
We demonstrate how TFT’s design allows for analysis of its individual components for enhanced interpretability with three use cases.
Variable Importance
One can observe how different variables impact retail sales by observing their model weights. For example, the largest weights for static variables were the specific store and item, while the largest weights for future variables were promotion period and national holiday (shown below).Variable importance for the retail dataset. The 10th, 50th, and 90th percentiles of the variable selection weights are shown, with values larger than 0.1 in bold purple.
Persistent Temporal Patterns
Visualizing persistent temporal patterns can help in understanding the time-dependent relationships present in a given dataset. We identify similar persistent patterns by measuring the contributions of features at fixed lags in the past forecasts at various horizons. Shown below, attention weights reveal the most important past time steps on which TFT bases its decisions.Persistent temporal patterns for the traffic dataset (𝛕 denotes the forecasting horizon) for the 10%, 50% and 90% quantile levels. Clear periodicity is observed with peaks being separated by ~24 hours, i.e., the model attends the most to the time steps that are at the same time of the day from past days, which is aligned with the expected daily traffic patterns.
The above shows the attention weight patterns across time, indicating how TFT learns persistent temporal patterns without any hard-coding. Such capability can help build trust with users because the output confirms expected known patterns. Model developers can also use these towards model improvements, e.g., via specific feature engineering or data collection.
Identifying Significant Events
Identifying sudden changes can be useful, as temporary shifts can occur due to the presence of significant events. TFT uses the distance between attention patterns at each point with the average pattern to identify the significant deviations. The figures below show that TFT can alter its attention between events — placing equal attention across past inputs when volatility is low, while attending more to sharp trend changes during high volatility periods.Event identification for S&P 500 realized volatility from 2002 through 2014.
Significant deviations in attention patterns can be observed above around periods of high volatility, corresponding to the peaks observed in dist(t), distance between attention patterns (red line). We use a threshold to denote significant events, as highlighted in purple.
Focusing on periods around the 2008 financial crisis, the bottom plot below zooms on midway through the significant event (evident from the increased attention on sharp trend changes), compared to the normal event in the top plot (where attention is equal over low volatility periods).
Event identification for S&P 500 realized volatility, a zoom of the above on a period from 2004 and 2005.
Event identification for S&P 500 realized volatility, a zoom of the above on a period from 2008 and 2009.


Real-World Impact
Finally, TFT has been used to help retail and logistics companies with demand forecasting by both improving forecasting accuracy and providing interpretability capabilities.
Additionally, TFT has potential applications for climate-related challenges: for example, reducing greenhouse gas emissions by balancing electricity supply and demand in real time, and improving the accuracy and interpretability of rainfall forecasting results.
Conclusion
We present a novel attention-based model for high-performance multi-horizon forecasting. In addition to improved performance across a range of datasets, TFT also contains specialized components for inherent interpretability — i.e., variable selection networks and interpretable multi-head attention. With three interpretability use-cases, we also demonstrate how these components can be used to extract insights on feature importance and temporal dynamics.
Acknowledgements
We gratefully acknowledge contributions of Bryan Lim, Nicolas Loeff, Minho Jin, Yaguang Li, and Andrew Moore.
-
Labels:
- Machine Intelligence
Other posts of interest
-
April 12, 2024
Contrastive neural audio separation- Machine Intelligence ·
- Sound & Accoustics
-
April 11, 2024
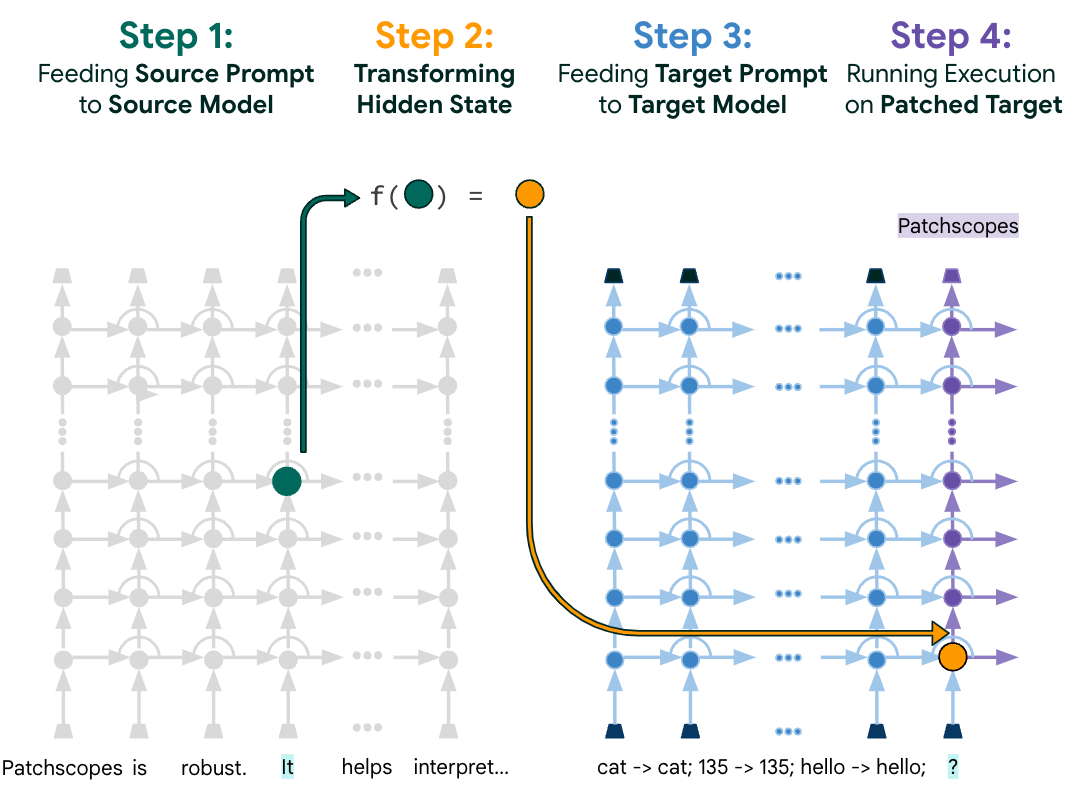
Patchscopes: A unifying framework for inspecting hidden representations of language models- Machine Intelligence ·
- Natural Language Processing ·
- Responsible AI
-
March 28, 2024
AutoBNN: Probabilistic time series forecasting with compositional bayesian neural networks- Algorithms & Theory ·
- Machine Intelligence ·
- Open Source Models & Datasets