TF-Ranking: A Scalable TensorFlow Library for Learning-to-Rank
December 5, 2018
Posted by Xuanhui Wang and Michael Bendersky, Software Engineers, Google AI
Ranking, the process of ordering a list of items in a way that maximizes the utility of the entire list, is applicable in a wide range of domains, from search engines and recommender systems to machine translation, dialogue systems and even computational biology. In applications like these (and many others), researchers often utilize a set of supervised machine learning techniques called learning-to-rank. In many cases, these learning-to-rank techniques are applied to datasets that are prohibitively large — scenarios where the scalability of TensorFlow could be an advantage. However, there is currently no out-of-the-box support for applying learning-to-rank techniques in TensorFlow. To the best of our knowledge, there are also no other open source libraries that specialize in applying learning-to-rank techniques at scale.
Today, we are excited to share TF-Ranking, a scalable TensorFlow-based library for learning-to-rank. As described in our recent paper, TF-Ranking provides a unified framework that includes a suite of state-of-the-art learning-to-rank algorithms, and supports pairwise or listwise loss functions, multi-item scoring, ranking metric optimization, and unbiased learning-to-rank.
TF-Ranking is fast and easy to use, and creates high-quality ranking models. The unified framework gives ML researchers, practitioners and enthusiasts the ability to evaluate and choose among an array of different ranking models within a single library. Moreover, we strongly believe that a key to a useful open source library is not only providing sensible defaults, but also empowering our users to develop their own custom models. Therefore, we provide flexible API's, within which the users can define and plug in their own customized loss functions, scoring functions and metrics.
Existing Algorithms and Metrics Support
The objective of learning-to-rank algorithms is minimizing a loss function defined over a list of items to optimize the utility of the list ordering for any given application. TF-Ranking supports a wide range of standard pointwise, pairwise and listwise loss functions as described in prior work. This ensures that researchers using the TF-Ranking library are able to reproduce and extend previously published baselines, and practitioners can make the most informed choices for their applications. Furthermore, TF-Ranking can handle sparse features (like raw text) through embeddings and scales to hundreds of millions of training instances. Thus, anyone who is interested in building real-world data intensive ranking systems such as web search or news recommendation, can use TF-Ranking as a robust, scalable solution.
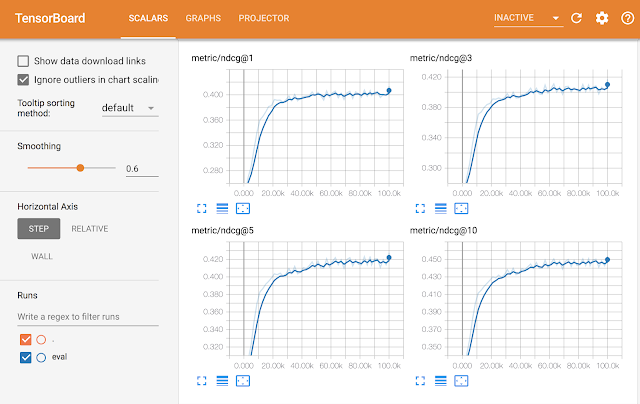
Empirical evaluation is an important part of any machine learning or information retrieval research. To ensure compatibility with prior work, we support many of the commonly used ranking metrics, including Mean Reciprocal Rank (MRR) and Normalized Discounted Cumulative Gain (NDCG). We also make it easy to visualize these metrics at training time on TensorBoard, an open source TensorFlow visualization dashboard.
 |
| An example of the NDCG metric (Y-axis) along the training steps (X-axis) displayed in the TensorBoard. It shows the overall progress of the metrics during training. Different methods can be compared directly on the dashboard. Best models can be selected based on the metric. |
TF-Ranking supports a novel scoring mechanism wherein multiple items (e.g., web pages) can be scored jointly, an extension of the traditional scoring paradigm in which single items are scored independently. One challenge in multi-item scoring is the difficulty for inference where items have to be grouped and scored in subgroups. Then, scores are accumulated per-item and used for sorting. To make these complexities transparent to the user, TF-Ranking provides a List-In-List-Out (LILO) API to wrap all this logic in the exported TF models.
 |
| The TF-Ranking library supports multi-item scoring architecture, an extension of traditional single-item scoring. |
Ranking Metric Optimization
An important research challenge in learning-to-rank is direct optimization of ranking metrics (such as the previously mentioned NDCG and MRR). These metrics, while being able to measure the performance of ranking systems better than the standard classification metrics like Area Under the Curve (AUC), have the unfortunate property of being either discontinuous or flat. Therefore standard stochastic gradient descent optimization of these metrics is problematic.
In recent work, we proposed a novel method, LambdaLoss, which provides a principled probabilistic framework for ranking metric optimization. In this framework, metric-driven loss functions can be designed and optimized by an expectation-maximization procedure. The TF-Ranking library integrates the recent advances in direct metric optimization and provides an implementation of LambdaLoss. We are hopeful that this will encourage and facilitate further research advances in the important area of ranking metric optimization.
Unbiased Learning-to-Rank
Prior research has shown that given a ranked list of items, users are much more likely to interact with the first few results, regardless of their relevance. This observation has inspired research interest in unbiased learning-to-rank, and led to the development of unbiased evaluation and several unbiased learning algorithms, based on training instances re-weighting. In the TF-Ranking library, metrics are implemented to support unbiased evaluation and losses are implemented for unbiased learning by natively supporting re-weighting to overcome the inherent biases in user interactions datasets.
Getting Started with TF-Ranking
TF-Ranking implements the TensorFlow Estimator interface, which greatly simplifies machine learning programming by encapsulating training, evaluation, prediction and export for serving. TF-Ranking is well integrated with the rich TensorFlow ecosystem. As described above, you can use Tensorboard to visualize ranking metrics like NDCG and MRR, as well as to pick the best model checkpoints using these metrics. Once your model is ready, it is easy to deploy it in production using TensorFlow Serving.
If you’re interested in trying TF-Ranking for yourself, please check out our GitHub repo, and walk through the tutorial examples. TF-Ranking is an active research project, and we welcome your feedback and contributions. We are excited to see how TF-Ranking can help the information retrieval and machine learning research communities.
Acknowledgements
This project was only possible thanks to the members of the core TF-Ranking team: Rama Pasumarthi, Cheng Li, Sebastian Bruch, Nadav Golbandi, Stephan Wolf, Jan Pfeifer, Rohan Anil, Marc Najork, Patrick McGregor and Clemens Mewald. We thank the members of the TensorFlow team for their advice and support: Alexandre Passos, Mustafa Ispir, Karmel Allison, Martin Wicke, and others. Finally, we extend our special thanks to our collaborators, interns and early adopters: Suming Chen, Zhen Qin, Chirag Sethi, Maryam Karimzadehgan, Makoto Uchida, Yan Zhu, Qingyao Ai, Brandon Tran, Donald Metzler, Mike Colagrosso, and many others at Google who helped in evaluating and testing the early versions of TF-Ranking.
Other posts of interest
-
April 12, 2024
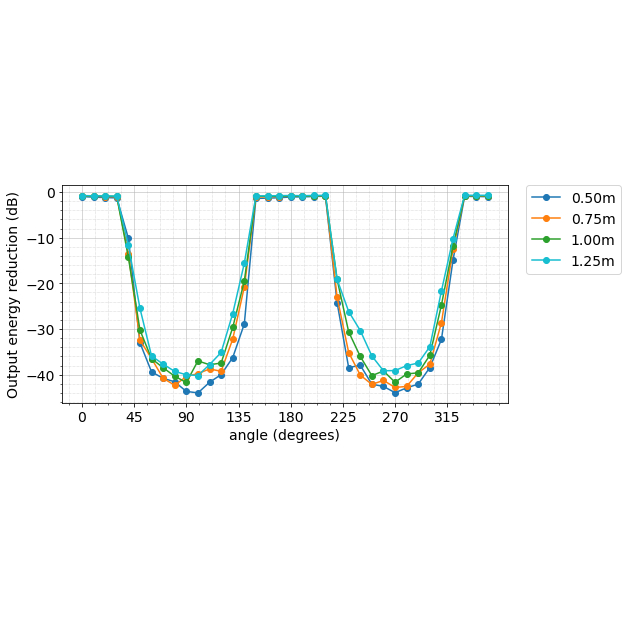
Contrastive neural audio separation- Machine Intelligence ·
- Sound & Accoustics
-
April 11, 2024
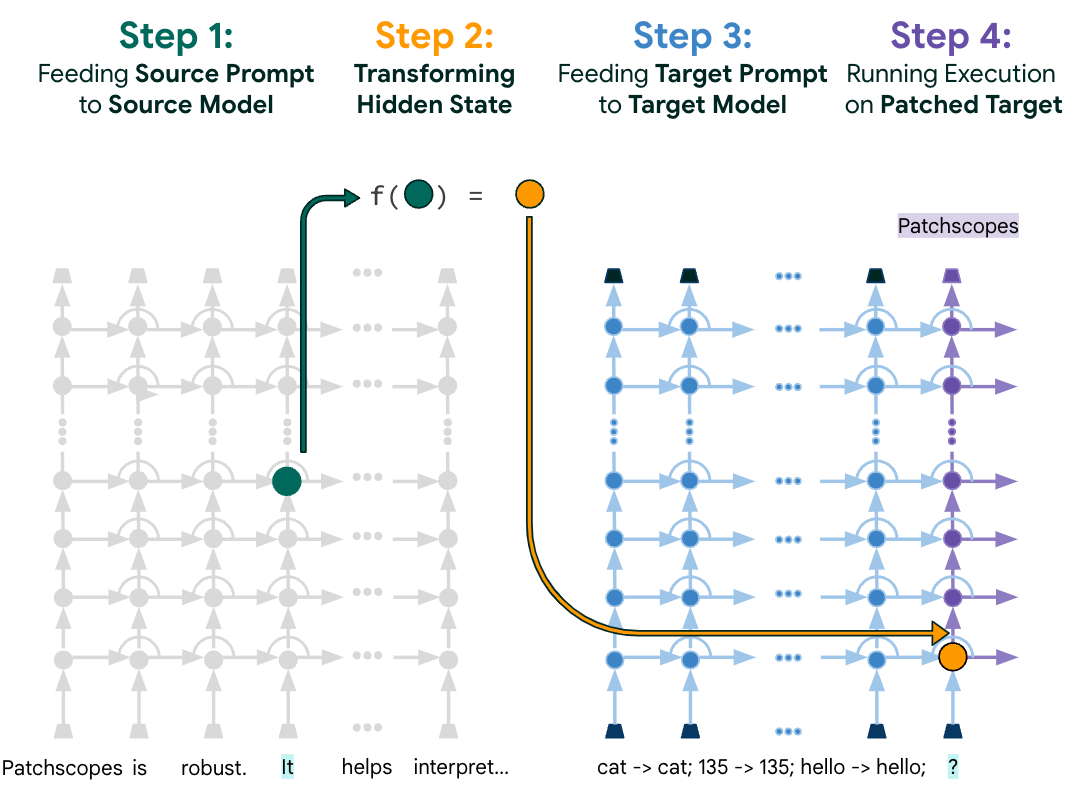
Patchscopes: A unifying framework for inspecting hidden representations of language models- Machine Intelligence ·
- Natural Language Processing ·
- Responsible AI
-
March 28, 2024
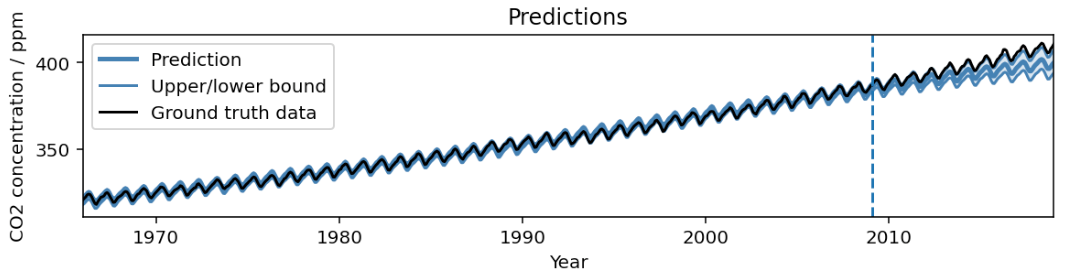
AutoBNN: Probabilistic time series forecasting with compositional bayesian neural networks- Algorithms & Theory ·
- Machine Intelligence ·
- Open Source Models & Datasets