An Inside Look at Flood Forecasting
September 19, 2019
Sella Nevo, Senior Software Engineer, Google Research, Tel Aviv
Several years ago, we identified flood forecasts as a unique opportunity to improve people’s lives, and began looking into how Google’s infrastructure and machine learning expertise can help in this field. Last year, we started our flood forecasting pilot in the Patna region, and since then we have expanded our flood forecasting coverage, as part of our larger AI for Social Good efforts. In this post, we discuss some of the technology and methodology behind this effort.
The Inundation Model
A critical step in developing an accurate flood forecasting system is to develop inundation models, which use either a measurement or a forecast of the water level in a river as an input, and simulate the water behavior across the floodplain.
 |
| A 3D visualization of a hydraulic model simulating various river conditions. |
Real-time Water Level Measurements
To run these models operationally, we need to know what is happening on the ground in real-time, and thus we rely on partnerships with the relevant government agencies to receive timely and accurate information. Our first governmental partner is the Indian Central Water Commission (CWC), which measures water levels hourly in over a thousand stream gauges across all of India, aggregates this data, and produces forecasts based on upstream measurements. The CWC provides these real-time river measurements and forecasts, which are then used as inputs for our models.
 |
| CWC employees measuring water level and discharge near Lucknow, India. |
Once we know how much water is in a river, it is critical that the models have a good map of the terrain. High-resolution digital elevation models (DEMs) are incredibly useful for a wide range of applications in the earth sciences, but are still difficult to acquire in most of the world, especially for flood forecasting. This is because meter-wide features of the ground conditions can create a critical difference in the resulting flooding (embankments are one exceptionally important example), but publicly accessible global DEMs have resolutions of tens of meters. To help address this challenge, we’ve developed a novel methodology to produce high resolution DEMs based on completely standard optical imagery.
We start with the large and varied collection of satellite images used in Google Maps. Correlating and aligning the images in large batches, we simultaneously optimize for satellite camera model corrections (for orientation errors, etc.) and for coarse terrain elevation. We then use the corrected camera models to create a depth map for each image. To make the elevation map, we optimally fuse the depth maps together at each location. Finally, we remove objects such as trees and bridges so that they don’t block water flow in our simulations. This can be done manually or by training convolutional neural networks that can identify where the terrain elevations need to be interpolated. The result is a roughly 1 meter DEM, which can be used to run hydraulic models.
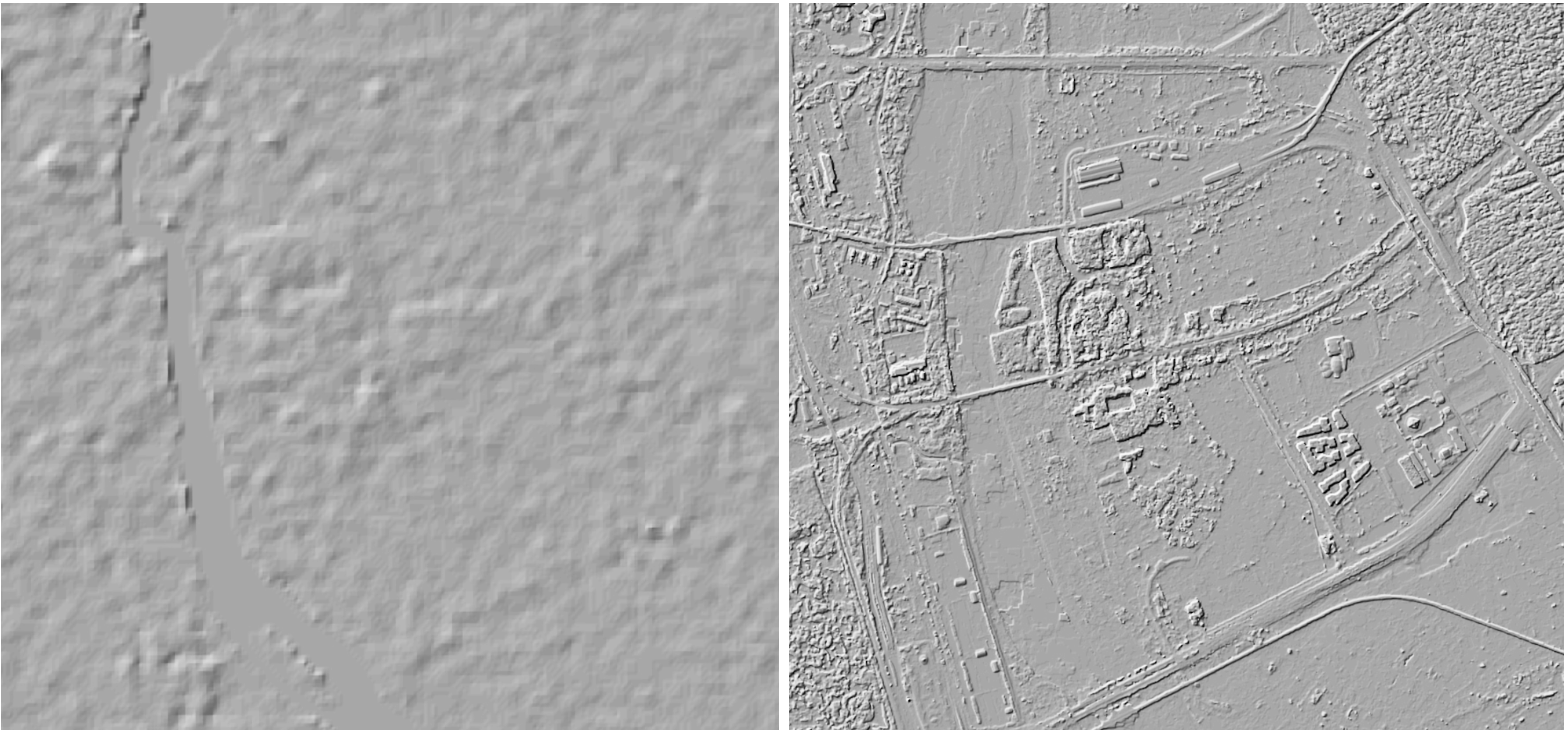 |
| A 30m SRTM-based DEM of the Yamuna river compared to a Google-generated 1m DEM of the same area. |
Once we have both these inputs - the riverine measurements and forecasts, and the elevation map - we can begin the modeling itself, which can be divided into two main components. The first and most substantial component is the physics-based hydraulic model, which updates the location and velocity of the water through time based on (an approximated) computation of the laws of physics. Specifically, we’ve implemented a solver for the 2D form of the shallow-water Saint-Venant equations. These models are suitably accurate when given accurate inputs and run at high resolutions, but their computational complexity creates challenges - it is proportional to the cube of the resolution desired. That is, if you double the resolution, you’ll need roughly 8 times as much processing time. Since we’re committed to the high-resolution required for highly accurate forecasts, this can lead to unscalable computational costs, even for Google!
To help address this problem, we’ve created a unique implementation of our hydraulic model, optimized for Tensor Processing Units (TPUs). While TPUs were optimized for neural networks (rather than differential equation solvers like our hydraulic model), their highly parallelized nature leads to the performance per TPU core being 85x times faster than the performance per CPU core. For additional efficiency improvements, we’re also looking at using machine learning to replace some of the physics-based algorithmics, extending data-driven discretization to two-dimensional hydraulic models, so we can support even larger grids and cover even more people.
 |
| A snapshot of a TPU-based simulation of flooding in Goalpara, mid-event. |
 |
| Flood warnings across Google’s interfaces. |
We still have a lot to do to fully realize the benefits of our inundation models. First and foremost, we’re working hard to expand the coverage of our operational systems, both within India and to new countries. There’s also a lot more information we want to be able to provide in real time, including forecasted flood depth, temporal information and more. Additionally, we’re researching how to best convey this information to individuals to maximize clarity and encourage them to take the necessary protective actions.
Computationally, while the inundation model is a good tool for improving the spatial resolution (and therefore the accuracy and reliability) of existing flood forecasts, multiple governmental agencies and international organizations we’ve spoken to are concerned about areas that do not have access to effective flood forecasts at all, or whose forecasts don’t provide enough lead time for effective response. In parallel to our work on the inundation model, we’re working on some basic research into improved hydrologic models, which we hope will allow governments not only to produce more spatially accurate forecasts, but also achieve longer preparation time.
Hydrologic models accept as inputs things like precipitation, solar radiation, soil moisture and the like, and produce a forecast for the river discharge (among other things), days into the future. These models are traditionally implemented using a combination of conceptual models approximating different core processes such as snowmelt, surface runoff, evapotranspiration and more.
 |
| The core processes of a hydrologic model. Designed by Daniel Klotz, JKU Institute for Machine Learning. |
 |
| The distribution of NSE scores on basins across the United States for various models, showing the proposed EA-LSTM consistently outperforming a wide range of commonly used models. |
Acknowledgements
There are many people who contributed to this large effort, and we’d like to highlight some of the key contributors: Aaron Yonas, Adi Mano, Ajai Tirumali, Avinatan Hassidim, Carla Bromberg, Damien Pierce, Gal Elidan, Guy Shalev, John Anderson, Karan Agarwal, Kartik Murthy, Manan Singhi, Mor Schlesinger, Ofir Reich, Oleg Zlydenko, Pete Giencke, Piyush Poddar, Ruha Devanesan, Slava Salasin, Varun Gulshan, Vova Anisimov, Yossi Matias, Yi-fan Chen, Yotam Gigi, Yusef Shafi, Zach Moshe and Zvika Ben-Haim.
-
Labels:
- General Science
- Machine Intelligence
Other posts of interest
-
April 12, 2024
Contrastive neural audio separation- Machine Intelligence ·
- Sound & Accoustics
-
April 11, 2024
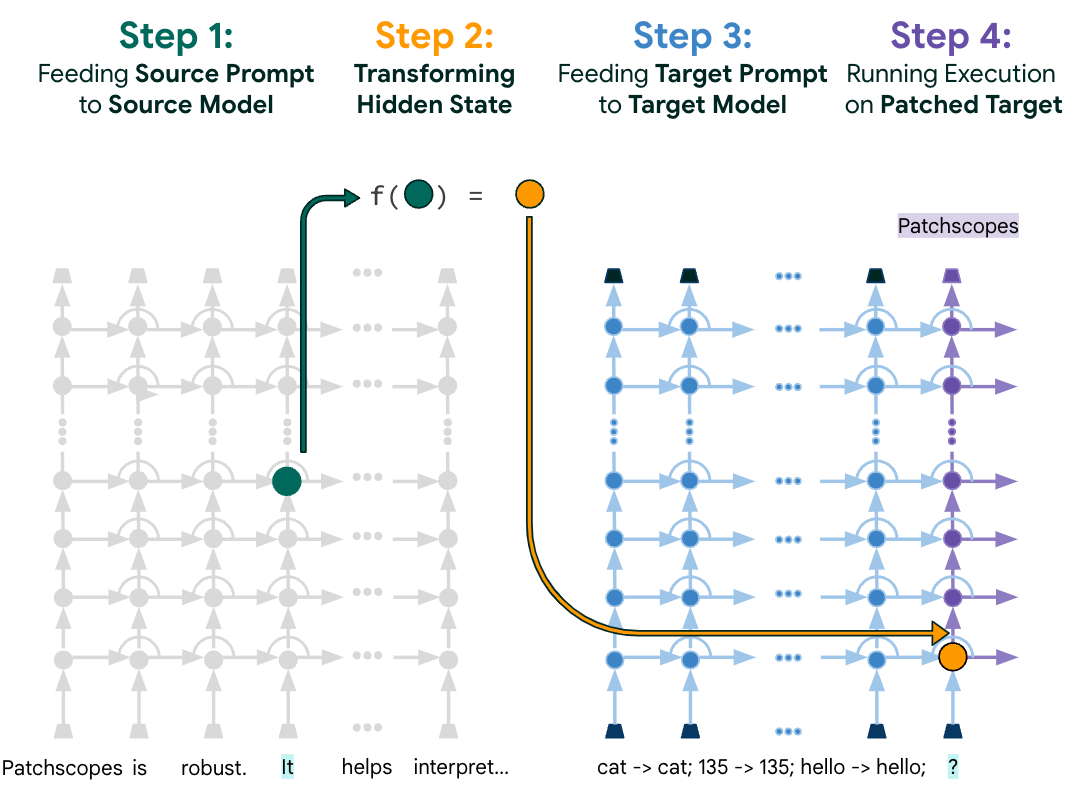
Patchscopes: A unifying framework for inspecting hidden representations of language models- Machine Intelligence ·
- Natural Language Processing ·
- Responsible AI
-
March 28, 2024
AutoBNN: Probabilistic time series forecasting with compositional bayesian neural networks- Algorithms & Theory ·
- Machine Intelligence ·
- Open Source Models & Datasets