
Making Sense of MOOC Data
March 27, 2014
Posted by Julia Wilkowski, Staff Instructional Designer
In order to further evolve the open education system and online platforms, Google’s course design and development teams continually experiment with massive, open online courses. Recently, at the Association for Computing Machinery’s recent Learning@Scale conference in Atlanta, GA, several members of our team presented findings about our online courses. Our research focuses on learners’ goals and activities as well as self-evaluation as an assessment tool. In this post, I will present highlights from our research as well as how we’ve applied this research to our current course, Making Sense of Data.
Google’s five online courses over the past two years have provided an opportunity for us to identify learning trends and refine instructional design. As we posted previously, learners register for online courses for a variety of reasons. During registration, we ask learners to identify their primary goal for taking the class. We found that just over half (52.5%) of 41,000 registrants intended to complete the Mapping with Google course; the other half aimed to learn portions of the curriculum without earning a certificate. Next we measured how well participants achieved those goals by observing various interaction behaviors in the course, such as watching videos, viewing text lessons, and activity completion. We found that 42.4% of 21,000 active learners (who did something in the course other than register) achieved the goals they selected during registration. Similarly, for our Introduction to Web Accessibility course, we found that 56.1% of 4,993 registrants intended to complete the course. Based on their interactions with course materials, we measured that 49.5% of 1,037 active learners achieved their goals.
Although imperfect, these numbers are more accurate measures of course success than completion rates. Because students come to the course for many different reasons, course designers should make it easier for learners to meet a variety of objectives. Since many participants in online courses may just want to learn a few new things, we can help them by releasing all course content at the outset of the course and enabling them to search for specific topics of interest. We are exploring other ways of personalizing courses to help learners achieve individual goals.
Our research also indicates that learners who complete activities are more likely to complete the course than peers who completed no activities. Activities include auto-graded multiple-choice or short-answer questions that encourage learners to practice skills from the course and receive instant feedback. In the Mapping with Google course, learners who completed at least sixty percent of course activities were much more likely to submit final projects than peers who finished fewer activities. This leads us to believe that as course designers, we should be paying more attention to creating effective, relevant activities than focusing so heavily on course content. We hypothesize that learners also use activities’ instant feedback to help them determine whether they should spend time reviewing the associated content. In this scenario, we believe that learners could benefit from experiencing activities before course content.
As technological solutions for assessing qualitative work are still evolving, an active area of our research involves self-evaluation. We are also intrigued by previous research showing the links between self-evaluation and enhanced metacognition. In several courses, we have asked learners to submit projects aligned with course objectives, calibrate themselves by evaluating sample work, then apply a rubric to assess their own work. Course staff graded a random sample of project submissions then compared the learners’ scores with course staff’s scores. In general, we found a moderate agreement on Advanced Power Searching (APS) case studies (55.1% within 1 point of each other on a 16-point scale), with an increased agreement on the Mapping projects (71.6% within 2 points of each other on a 27-point scale). We also observed that students submitted high quality projects overall, with course staff scoring 73% of APS assignments a B (80%) or above; similarly, course staff evaluated 94% of Mapping projects as a B or above.
What changed between the two courses that allowed for a higher agreement with the mapping course? The most important change seems to be more objective criteria for the mapping project rubric. We also believe that we haven’t given enough weight to teaching learners how to evaluate their own work. We plan to keep experimenting with self-evaluation in future courses.
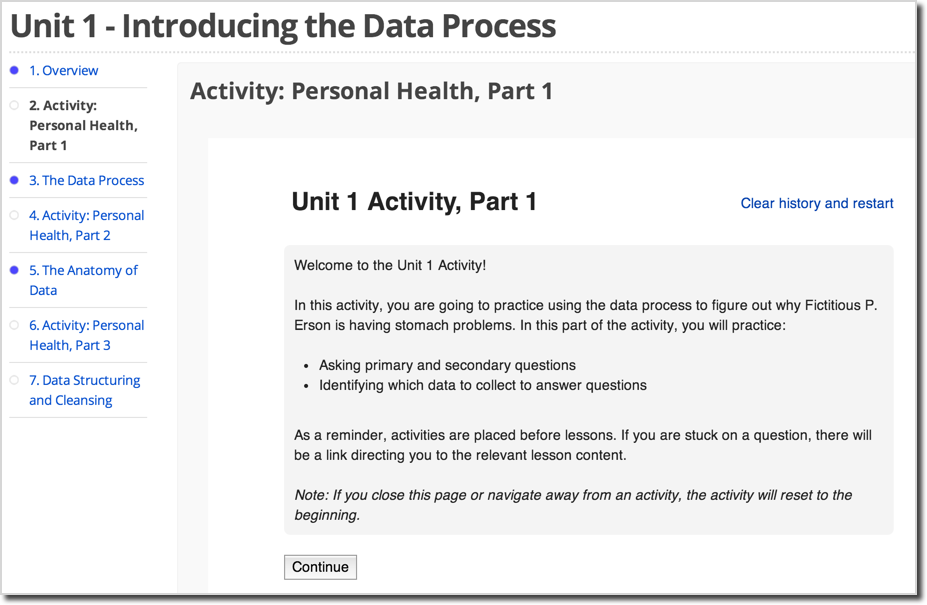
Since we are dedicated to experimenting with courses, we have not only applied these findings to the Making Sense of Data course, but we have also chosen to experiment with new open-source software and tools. We’re exploring the following aspects of online education in this class:
- Placing activities before content
- Reduced use of videos
- Final project that includes self-reflection without scores
- New open-source technologies, including authoring the course using edX studio and importing it into cbX (running on Google’s AppEngine platform) as well as Oppia explorations
We hope that our research and the open-source technologies we’re using will inspire educators and researchers to continue to evolve the next generation of online learning platforms.
-
Labels:
- Education Innovation
Other posts of interest
-
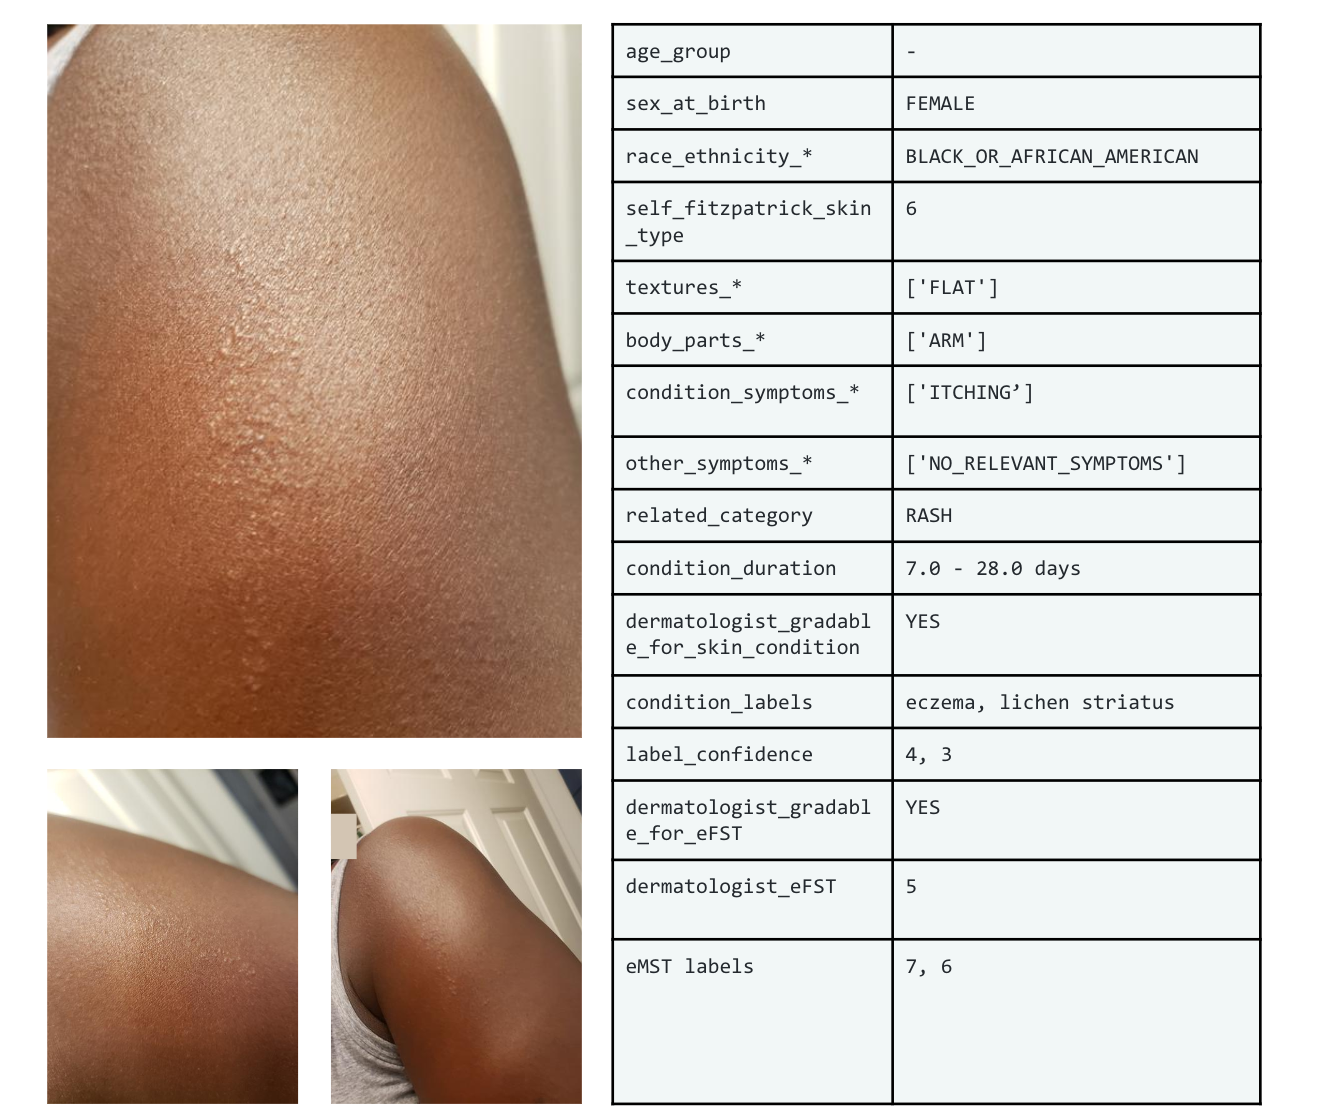
March 19, 2024
SCIN: A new resource for representative dermatology images- Education Innovation ·
- Health & Bioscience ·
- Open Source Models & Datasets
-

October 19, 2023
English learners can now practice speaking on Search- Education Innovation ·
- Product ·
- Speech Processing
-
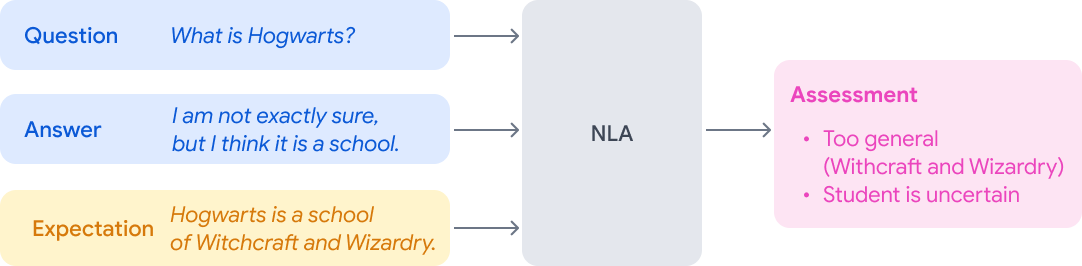
October 26, 2022
Natural Language Assessment: A New Framework to Promote Education- Education Innovation ·
- Natural Language Processing