Understanding Performance Fluctuations in Quantum Processors
August 31, 2018
Posted by Paul V. Klimov, Research Scientist, Google AI Quantum Team
Quick links
One area of research the Google AI Quantum team pursues is building quantum processors from superconducting electrical circuits, which are attractive candidates for implementing quantum bits (qubits). While superconducting circuits have demonstrated state-of-the-art performance and extensibility to modest processor sizes comprising tens of qubits, an outstanding challenge is stabilizing their performance, which can fluctuate unpredictably. Although performance fluctuations have been observed in numerous superconducting qubit architectures, their origin isn’t well understood, impeding progress in stabilizing processor performance.
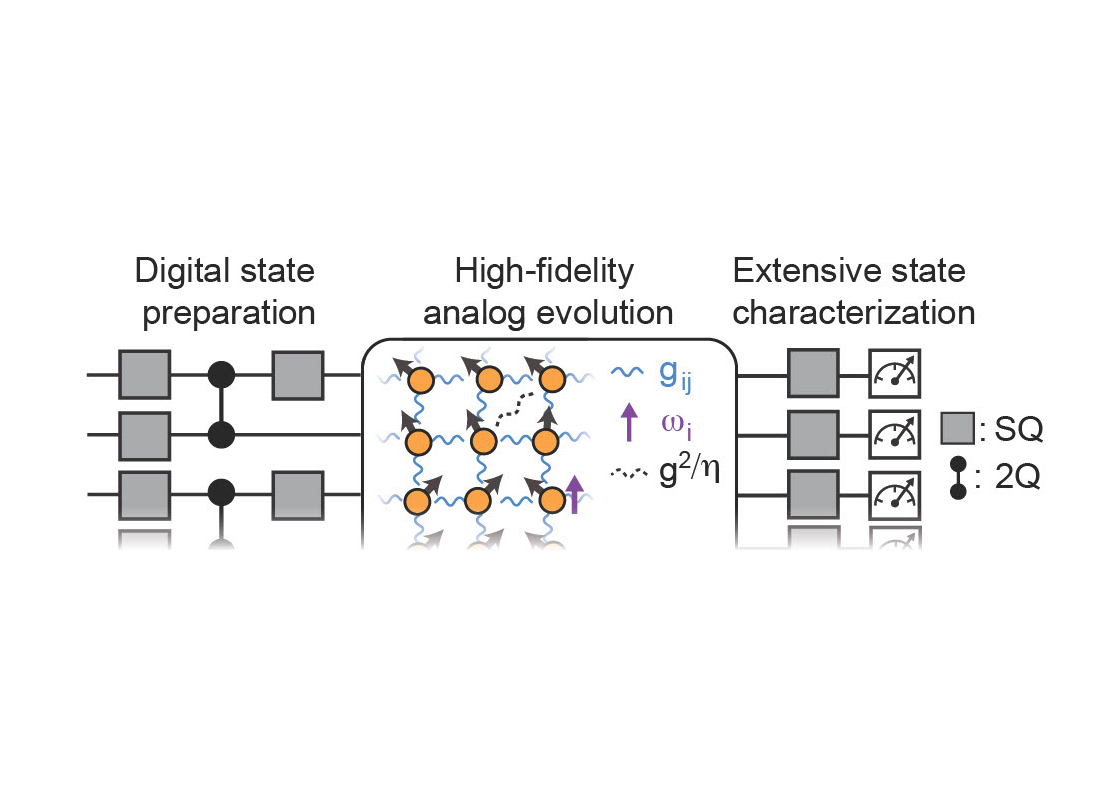
In “Fluctuations of Energy-Relaxation Times in Superconducting Qubits” published in this week’s Physical Review Letters, we use qubits as probes of their environment to show that performance fluctuations are dominated by material defects. This was done by investigating qubits’ energy relaxation times (T1) — a popular performance metric that gives the length of time that it takes for a qubit to undergo energy-relaxation from its excited to ground state — as a function of operating frequency and time.
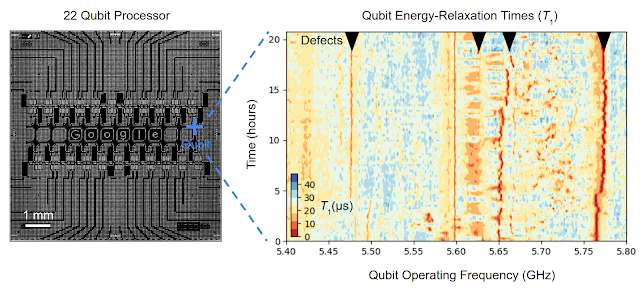
In measuring T1, we found that some qubit operating frequencies are significantly worse than others, forming energy-relaxation hot-spots (see figure below). Our research suggests that these hot spots are due to material defects, which are themselves quantum systems that can extract energy from qubits when their frequencies overlap (i.e. are “resonant”). Surprisingly, we found that the energy-relaxation hot spots are not static, but “move” on timescales ranging from minutes to hours. From these observations, we concluded that the dynamics of defects’ frequencies into and out of resonance with qubits drives the most significant performance fluctuations.
 |
| Left: A quantum processor similar to the one that was used to investigate qubit performance fluctuations. One qubit is highlighted in blue. Right: One qubit’s energy-relaxation time “T1” plotted as a function of it’s operating frequency and time. We see energy-relaxation hotspots, which our data suggest are due to material defects (black arrowheads). The motion of these hotspots into and out-of resonance with the qubit are responsible for the most significant energy-relaxation fluctuations. Note that these data were taken over a frequency band with an above-average density of defects. |
The fact that qubits can be used to investigate individual material defects - which are believed to have atomic dimensions, millions of times smaller than our qubits - demonstrates that they are powerful metrological tools. While it’s clear that defect research could help address outstanding problems in materials physics, it’s perhaps surprising that it has direct implications on improving the performance of today’s quantum processors. In fact, defect metrology already informs our processor design and fabrication, and even the mathematical algorithms that we use to avoid defects during quantum processor runtime. We hope this research motivates further work into understanding material defects in superconducting circuits.
-
Labels:
- Quantum