Improved Grading of Prostate Cancer Using Deep Learning
November 16, 2018
Posted by Martin Stumpe, Technical Lead and Craig Mermel, Product Manager, Healthcare, Google AI
(Updated Jun 7, 2019: The work described in this blogpost has been published in Nature Partner Journal (npj) Digital Medicine.)
Approximately 1 in 9 men in the United States will develop prostate cancer in their lifetime, making it the most common cancer in males. Despite being common, prostate cancers are frequently non-aggressive, making it challenging to determine if the cancer poses a significant enough risk to the patient to warrant treatment such as surgical removal of the prostate (prostatectomy) or radiation therapy. A key factor that helps in the “risk stratification” of prostate cancer patients is the Gleason grade, which classifies the cancer cells based on how closely they resemble normal prostate glands when viewed on a slide under a microscope.
However, despite its widely recognized clinical importance, Gleason grading of prostate cancer is complex and subjective, as evidenced by studies reporting inter-pathologist disagreements ranging from 30-53% [1][2]. Furthermore, there are not enough speciality trained pathologists to meet the global demand for prostate cancer pathology, especially outside the United States. Recent guidelines also recommend that pathologists report the percentage of tumor of different Gleason patterns in their final report, which adds to the workload and is yet another subjective challenge for the pathologist [3]. Overall, these issues suggest an opportunity to improve the diagnosis and clinical management of prostate cancer using deep learning–based models, similar to how Google and others used such techniques to demonstrate the potential to improve metastatic breast cancer detection.
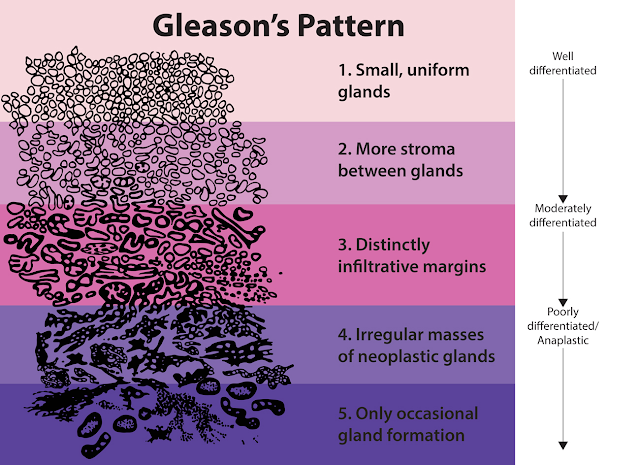
In “Development and Validation of a Deep Learning Algorithm for Improving Gleason Scoring of Prostate Cancer”, we explore whether deep learning could improve the accuracy and objectivity of Gleason grading of prostate cancer in prostatectomy specimens. We developed a deep learning system (DLS) that mirrors a pathologist’s workflow by first categorizing each region in a slide into a Gleason pattern, with lower patterns corresponding to tumors that more closely resemble normal prostate glands. The DLS then summarizes an overall Gleason grade group based on the two most common Gleason patterns present. The higher the grade group, the greater the risk of further cancer progression and the more likely the patient is to benefit from treatment.
 |
| Visual examples of Gleason patterns, which are used in the Gleason system for grading prostate cancer. Individual cancer patches are assigned a Gleason pattern based on how closely the cancer resembles normal prostate tissue, with lower numbers corresponding to more well differentiated tumors. Image Source: National Institutes of Health. |
In the paper, we show that our DLS achieved an overall accuracy of 70%, compared to an average accuracy of 61% achieved by US board-certified general pathologists in our study. Of 10 high-performing individual general pathologists who graded every slide in the validation set, the DLS was more accurate than 8. The DLS was also more accurate than the average pathologist at Gleason pattern quantitation. These improvements in Gleason grading translated into better clinical risk stratification: the DLS better identified patients at higher risk for disease recurrence after surgery than the average general pathologist, potentially enabling doctors to use this information to better match patients to therapy.
 |
| Comparison of scoring performance of the DLS with pathologists. a: Accuracy of the DLS (in red) compared with the mean accuracy among a cohort-of-29 pathologists (in green). Error bars indicate 95% confidence intervals. b: Comparison of risk stratification provided by the DLS, the cohort-of-29 pathologists, and the genitourinary specialist pathologists. Patients are divided into low and high risk groups based on their Gleason grade group, where a larger separation between the Kaplan-Meier curves of these risk groups indicates better stratification. |
 |
| Assessing the region-level classification of the DLS. a: Annotations from 3 pathologists compared to DLS predictions. The pathologists show general concordance on the location and the extent of tumor areas, but poor agreement in classifying Gleason patterns. The DLS’s precision Gleason pattern for each region is represented by interpolating between the DLS’s prediction patterns for Gleason patterns 3 (green), 4 (yellow), and 5 (red). b: DLS prediction patterns compared to the distribution of pathologists’ Gleason pattern classifications on 41 million annotated image patches from the test dataset. On patches where pathologists are discordant, where the tissue is more likely to be on the cusp of two patterns, the DLS reflects this ambiguity in its prediction scores. |
Acknowledgements
This work involved the efforts of a multidisciplinary team of software engineers, researchers, clinicians and logistics support staff. Key contributors to this project include Kunal Nagpal, Davis Foote, Yun Liu, Po-Hsuan (Cameron) Chen, Ellery Wulczyn, Fraser Tan, Niels Olson, Jenny L. Smith, Arash Mohtashamian, James H. Wren, Greg S. Corrado, Robert MacDonald, Lily H. Peng, Mahul B. Amin, Andrew J. Evans, Ankur R. Sangoi, Craig H. Mermel, Jason D. Hipp and Martin C. Stumpe. We would also like to thank Tim Hesterberg, Michael Howell, David Miller, Alvin Rajkomar, Benny Ayalew, Robert Nagle, Melissa Moran, Krishna Gadepalli, Aleksey Boyko, and Christopher Gammage. Lastly, this work would not have been possible without the aid of the pathologists who annotated data for this study.
References
- Interobserver Variability in Histologic Evaluation of Radical Prostatectomy Between Central and Local Pathologists: Findings of TAX 3501 Multinational Clinical Trial, Netto, G. J., Eisenberger, M., Epstein, J. I. & TAX 3501 Trial Investigators, Urology 77, 1155–1160 (2011).
- Phase 3 Study of Adjuvant Radiotherapy Versus Wait and See in pT3 Prostate Cancer: Impact of Pathology Review on Analysis, Bottke, D., Golz, R., Störkel, S., Hinke, A., Siegmann, A., Hertle, L., Miller, K., Hinkelbein, W., Wiegel, T., Eur. Urol. 64, 193–198 (2013).
- Utility of Quantitative Gleason Grading in Prostate Biopsies and Prostatectomy Specimens, Sauter, G. Steurer, S., Clauditz, T. S., Krech, T., Wittmer, C., Lutz, F., Lennartz, M., Janssen, T., Hakimi, N., Simon, R., von Petersdorff-Campen, M., Jacobsen, F., von Loga, K., Wilczak, W., Minner, S., Tsourlakis, M. C., Chirico, V., Haese, A., Heinzer, H., Beyer, B., Graefen, M., Michl, U., Salomon, G., Steuber, T., Budäus, L. H., Hekeler, E., Malsy-Mink, J., Kutzera, S., Fraune, C., Göbel, C., Huland, H., Schlomm, T., Clinical Eur. Urol. 69, 592–598 (2016).
Other posts of interest
-
April 23, 2024
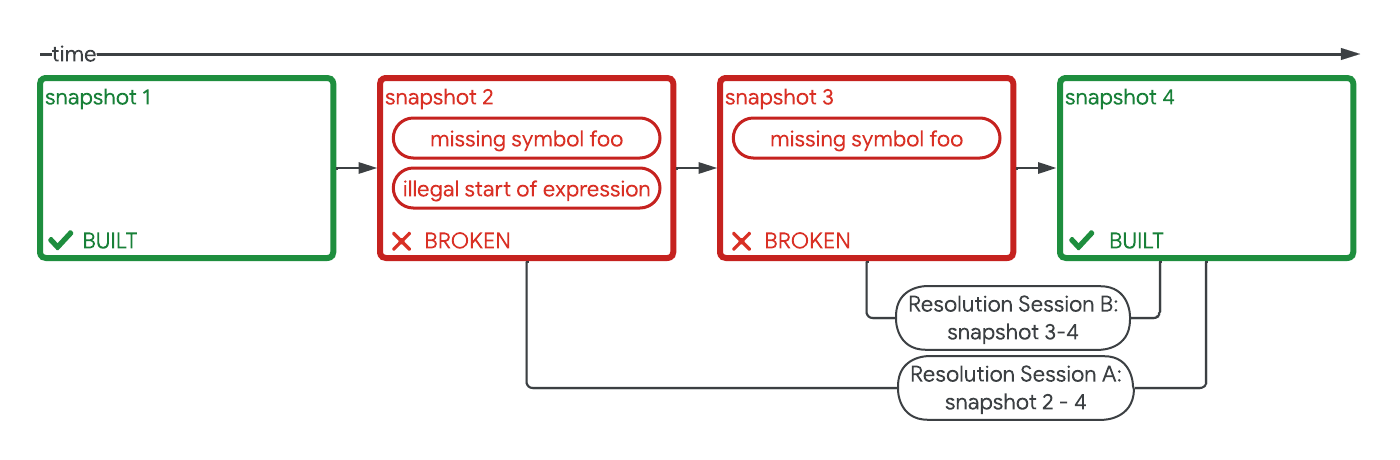
Safely repairing broken builds with ML- Machine Intelligence ·
- Software Systems & Engineering
-
April 12, 2024
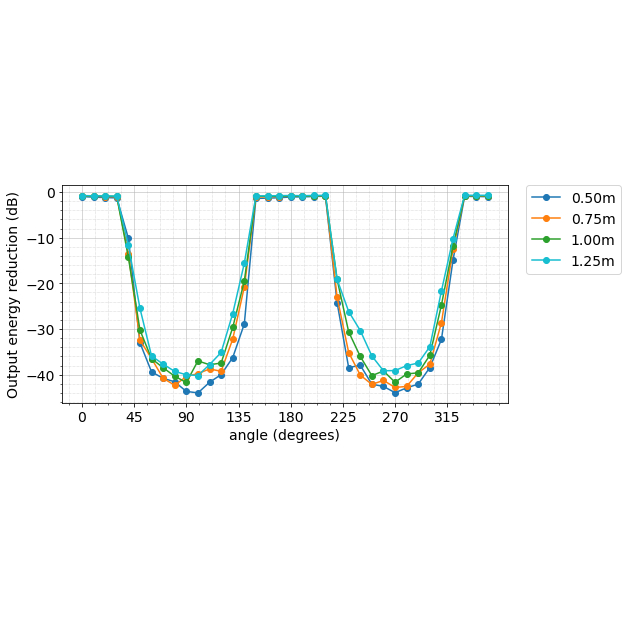
Contrastive neural audio separation- Machine Intelligence ·
- Sound & Accoustics
-
April 11, 2024
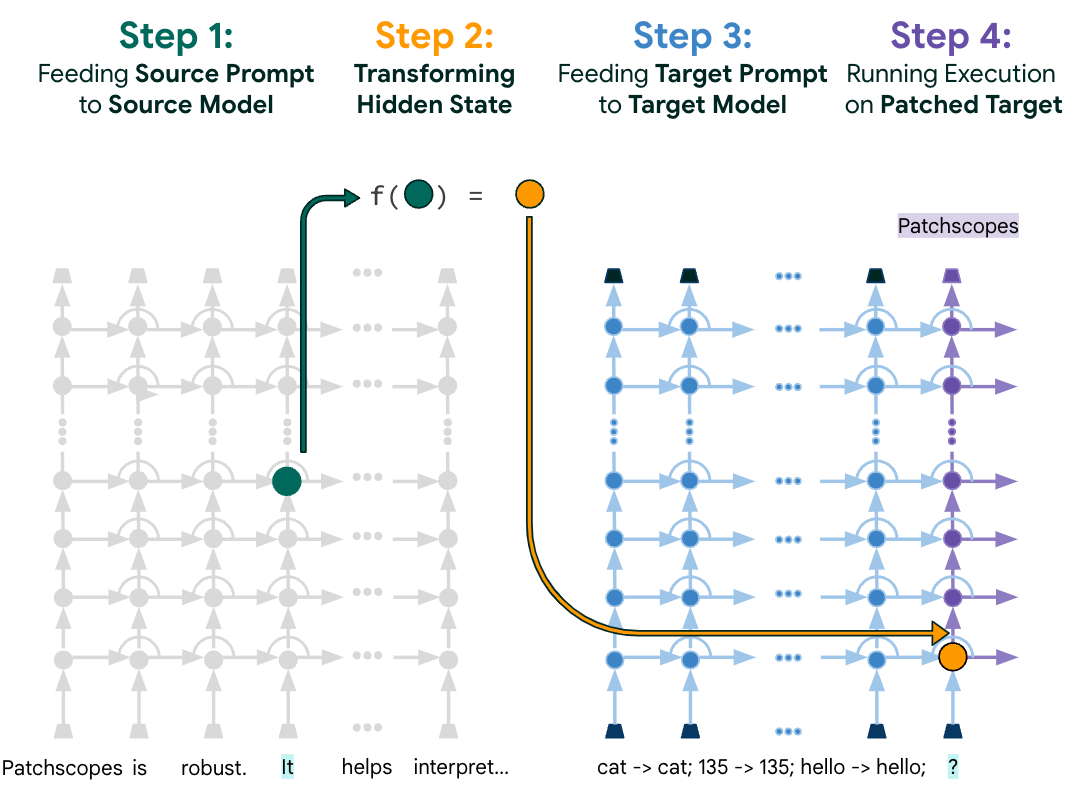
Patchscopes: A unifying framework for inspecting hidden representations of language models- Machine Intelligence ·
- Natural Language Processing ·
- Responsible AI