Audio and Visual Quality Measurement Using Fréchet Distance
October 22, 2019
Posted by Kevin Kilgour, Software Engineer and Thomas Unterthiner, Research Software Engineer, Google Research, Zürich
Quick links
"I often say that when you can measure what you are speaking about, and express it in numbers, you know something about it; but when you cannot measure it, when you cannot express it in numbers, your knowledge is of a meagre and unsatisfactory kind.”
- — William Thomson (Lord Kelvin), Lecture on "Electrical Units of Measurement" (3 May 1883), published in Popular Lectures Vol. I, p. 73
 |
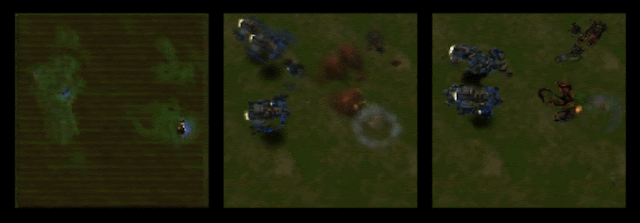
| Videos generated from various models trained on sequences from the StarCraft Video (SCV) dataset. |
General Description of Fréchet Distance
The goal of a generative model is to learn to produce samples that look similar to the ones on which it has been trained, such that it knows what properties and features are likely to appear in the data, and which ones are unlikely. In other words, a generative model must learn the probability distribution of the training data. In many cases, the target distributions for generative models are very high-dimensional. For example, a single image of 128x128 pixels with 3 color channels has almost 50k dimensions, while a second-long video clip might consist of dozens (or hundreds) of such frames with audio that may have 16,000 samples. Calculating distances between such high dimensional distributions in order to quantify how well a given model succeeds at a task is very difficult. In the case of pictures, one could look at a few samples to gauge visual quality, but doing so for every model trained is not feasible.
In addition, generative adversarial networks (GANs) tend to focus on a few modes of the overall target distribution, while completely ignoring others. For example, they may learn to generate only one type of object or only a select few viewing angles. As a consequence, looking only at a limited number of samples from the model may not indicate whether the network learned the entire distribution successfully. To remedy this, a metric is needed that aligns well with human judgement of quality, while also taking the properties of the target distribution into account.
One common solution for this problem is the so-called Fréchet Inception Distance (FID) metric, which was specifically designed for images. The FID takes a large number of images from both the target distribution and the generative model, and uses the Inception object-recognition network to embed each image into a lower-dimensional space that captures the important features. Then it computes the so-called Fréchet distance between these samples, which is a common way of calculating distances between distributions that provides a quantitative measure of how similar the two distributions actually are.
 |
| A key component for both metrics is a pre-trained model that converts the video or audio clip into an N-dimensional embedding. |
Building on the principles of FID that have been successfully applied to the image domain, we propose both Fréchet Video Distance (FVD) and Fréchet Audio Distance (FAD). Unlike popular metrics such as peak signal-to-noise ratio or the structural similarity index, FVD looks at videos in their entirety, and thereby avoids the drawbacks of framewise metrics.
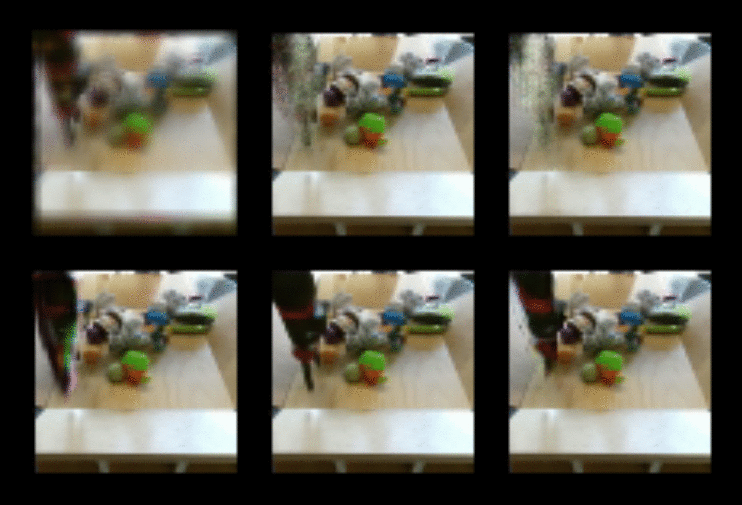 |
| Examples of videos of a robot arm, judged by the new FVD metric. FVD values were found to be approximately 2000, 1000, 600, 400, 300 and 150 (left-to-right; top-to-bottom). A lower FVD clearly correlates with higher video quality. |
Below is a 2-D visualization of the audio embedding vectors from which we compute the FAD. Each point corresponds to the embedding of a 5-second audio clip, where the blue points are from clean music and other points represent audio that has been distorted in some way. The estimated multivariate Gaussian distributions are presented as concentric ellipses. As the magnitude of the distortions increase, the overlap between their distributions and that of the clean audio decreases. The separation between these distributions is what the Fréchet distance is measuring.
 |
| In the animation, we can see that as the magnitude of the distortions increases, the Gaussian distributions of the distorted audio overlaps less with the clean distribution. The magnitude of this separation is what the Fréchet distance is measuring. |
It is important for FAD and FVD to closely track human judgement, since that is the gold standard for what looks and sounds “realistic”. So, we performed a large-scale human study to determine how well our new metrics align with qualitative human judgment of generated audio and video. For the study, human raters examined 10,000 video pairs and 69,000 5-second audio clips. For the FAD we asked human raters to compare the effect of two different distortions on the same audio segment, randomizing both the pair of distortions that they compared and the order in which they appeared. The raters were asked “Which audio clip sounds most like a studio-produced recording?” The collected set of pairwise evaluations was then ranked using a Plackett-Luce model, which estimates a worth value for each parameter configuration. Comparison of the worth values to the FAD demonstrates that the FAD correlates quite well with human judgement.
 |
| This figure compares the FAD calculated between clean background music and music distorted by a variety of methods (e.g., pitch down, Gaussian noise, etc.) to the associated worth values from human evaluation. Each type of distortion has two data points representing high and low extremes in the distortion applied. The quantization distortion (purple circles), for example, limits the audio to a specific number of bits per sample, where the two data points represent two different bitrates. Both human raters and the FAD assigned higher values (i.e., “less realistic”) to the lower bitrate quantization. Overall log FAD correlates well with human judgement — a perfect correlation between the log FAD and human perception would result in a straight line. |
We are currently making great strides in generative models. FAD and FVD will help us keeping this progress measurable, and will hopefully lead us to improve our models for audio and video generation.
Acknowledgements
There are many people who contributed to this large effort, and we’d like to highlight some of the key contributors: Sjoerd van Steenkiste, Karol Kurach, Raphael Marinier, Marcin Michalski, Sylvain Gelly, Mauricio Zuluaga, Dominik Roblek, Matthew Sharifi as well as the extended Google Brain Team in Zürich.
Quick links
Other posts of interest
-

July 28, 2025
SensorLM: Learning the language of wearable sensors- Generative AI ·
- Health & Bioscience ·
- Machine Intelligence
-

July 22, 2025
LSM-2: Learning from incomplete wearable sensor data- Generative AI ·
- Health & Bioscience ·
- Machine Intelligence
-

July 17, 2025
Measuring heart rate with consumer ultra-wideband radar- Hardware & Architecture ·
- Health & Bioscience ·
- Machine Intelligence